

Introduction
When I started this Azure App Service series, my goal wasn't just to explain what Azure App Service is that I wanted to share the things I've learned while working with it in real production environments.
Introduction
One thing I've learned over the years is that deploying an application is actually the easy part. Keeping it healthy, available, and performing well is where the real work begins.
I've been involved in several Azure projects where the application itself wasn't the issue. Instead, it was a slow database query, a third-party API taking too long to respond, an unexpected spike in traffic, or simply an application that had been running for weeks and slowly consuming more memory than expected.
Without proper monitoring, these issues can go unnoticed until users start calling the support team.
That's why I always tell customers that monitoring shouldn't be something you add later. It should be part of the deployment from day one.
Azure Gives You Most of What You Need
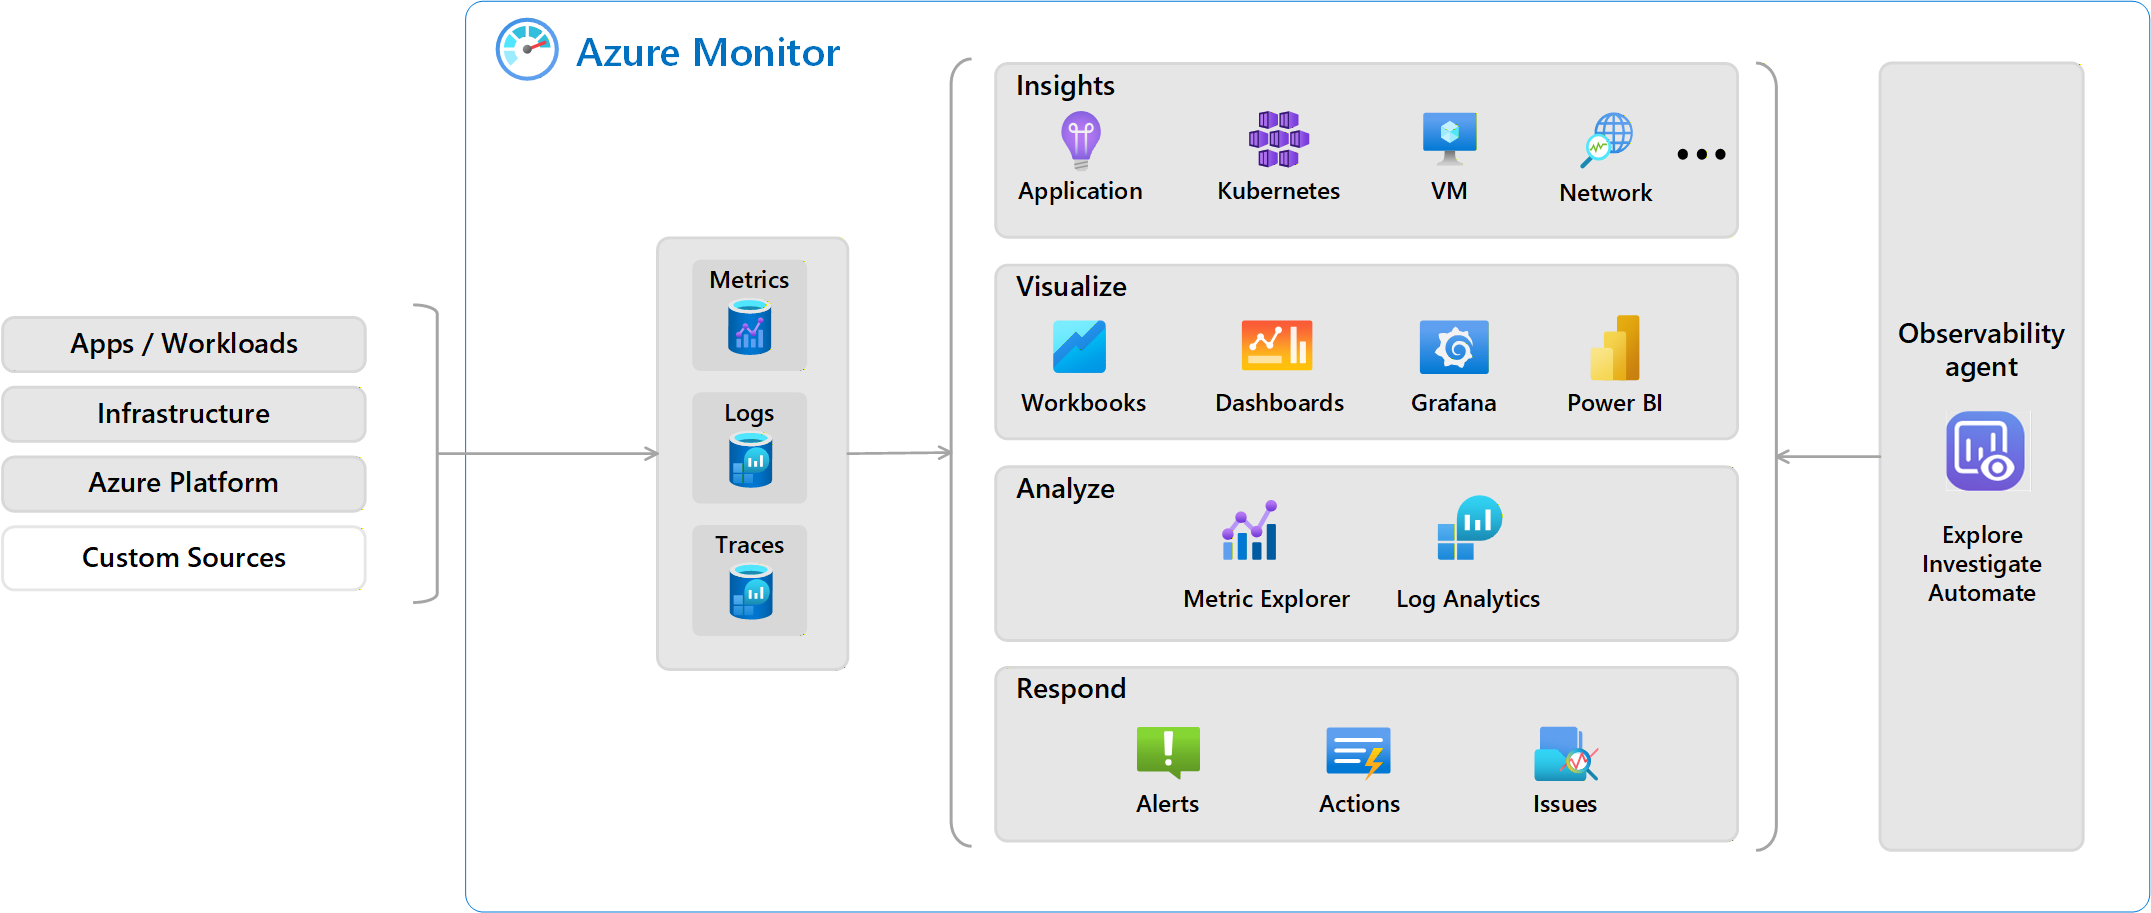
One of the things I like about Azure is that Microsoft has already built a solid monitoring ecosystem. You don't have to purchase several third-party tools just to understand what's happening inside your application.
For most Azure App Service deployments, I usually rely on four key services:
These services work really well together and provide almost everything you need to understand your application's health.
Application Insights Is Probably My Favorite
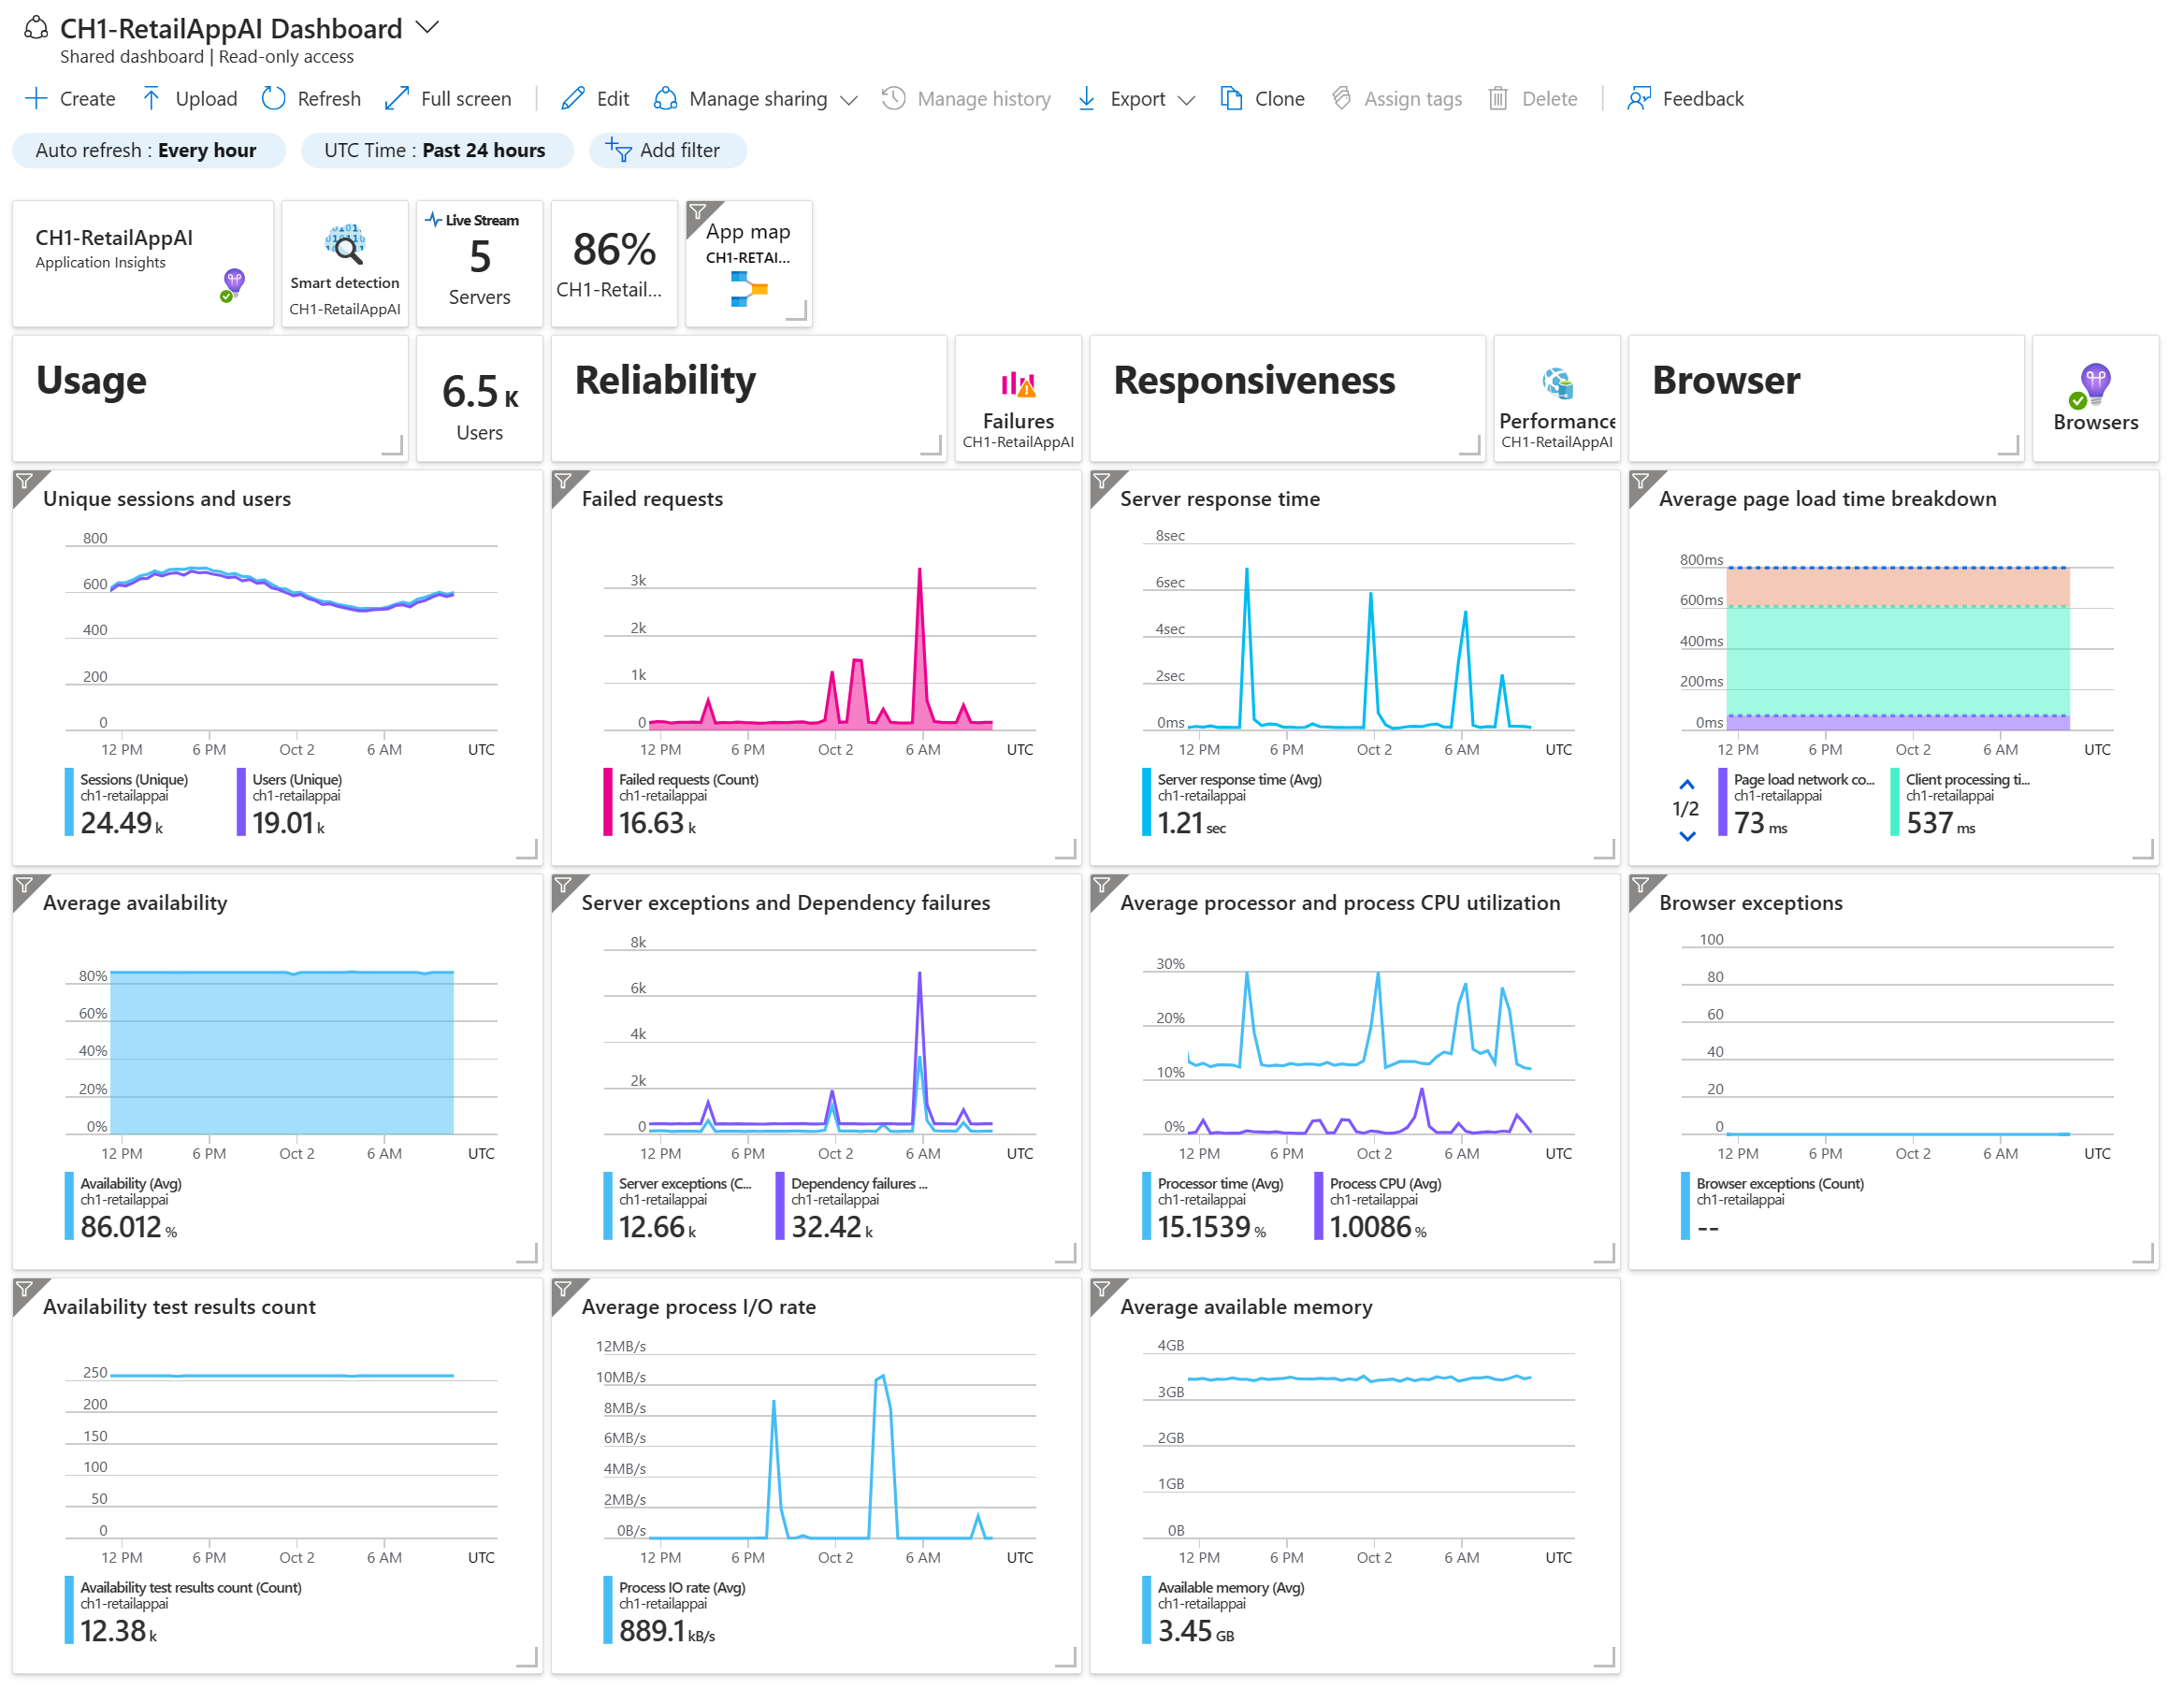
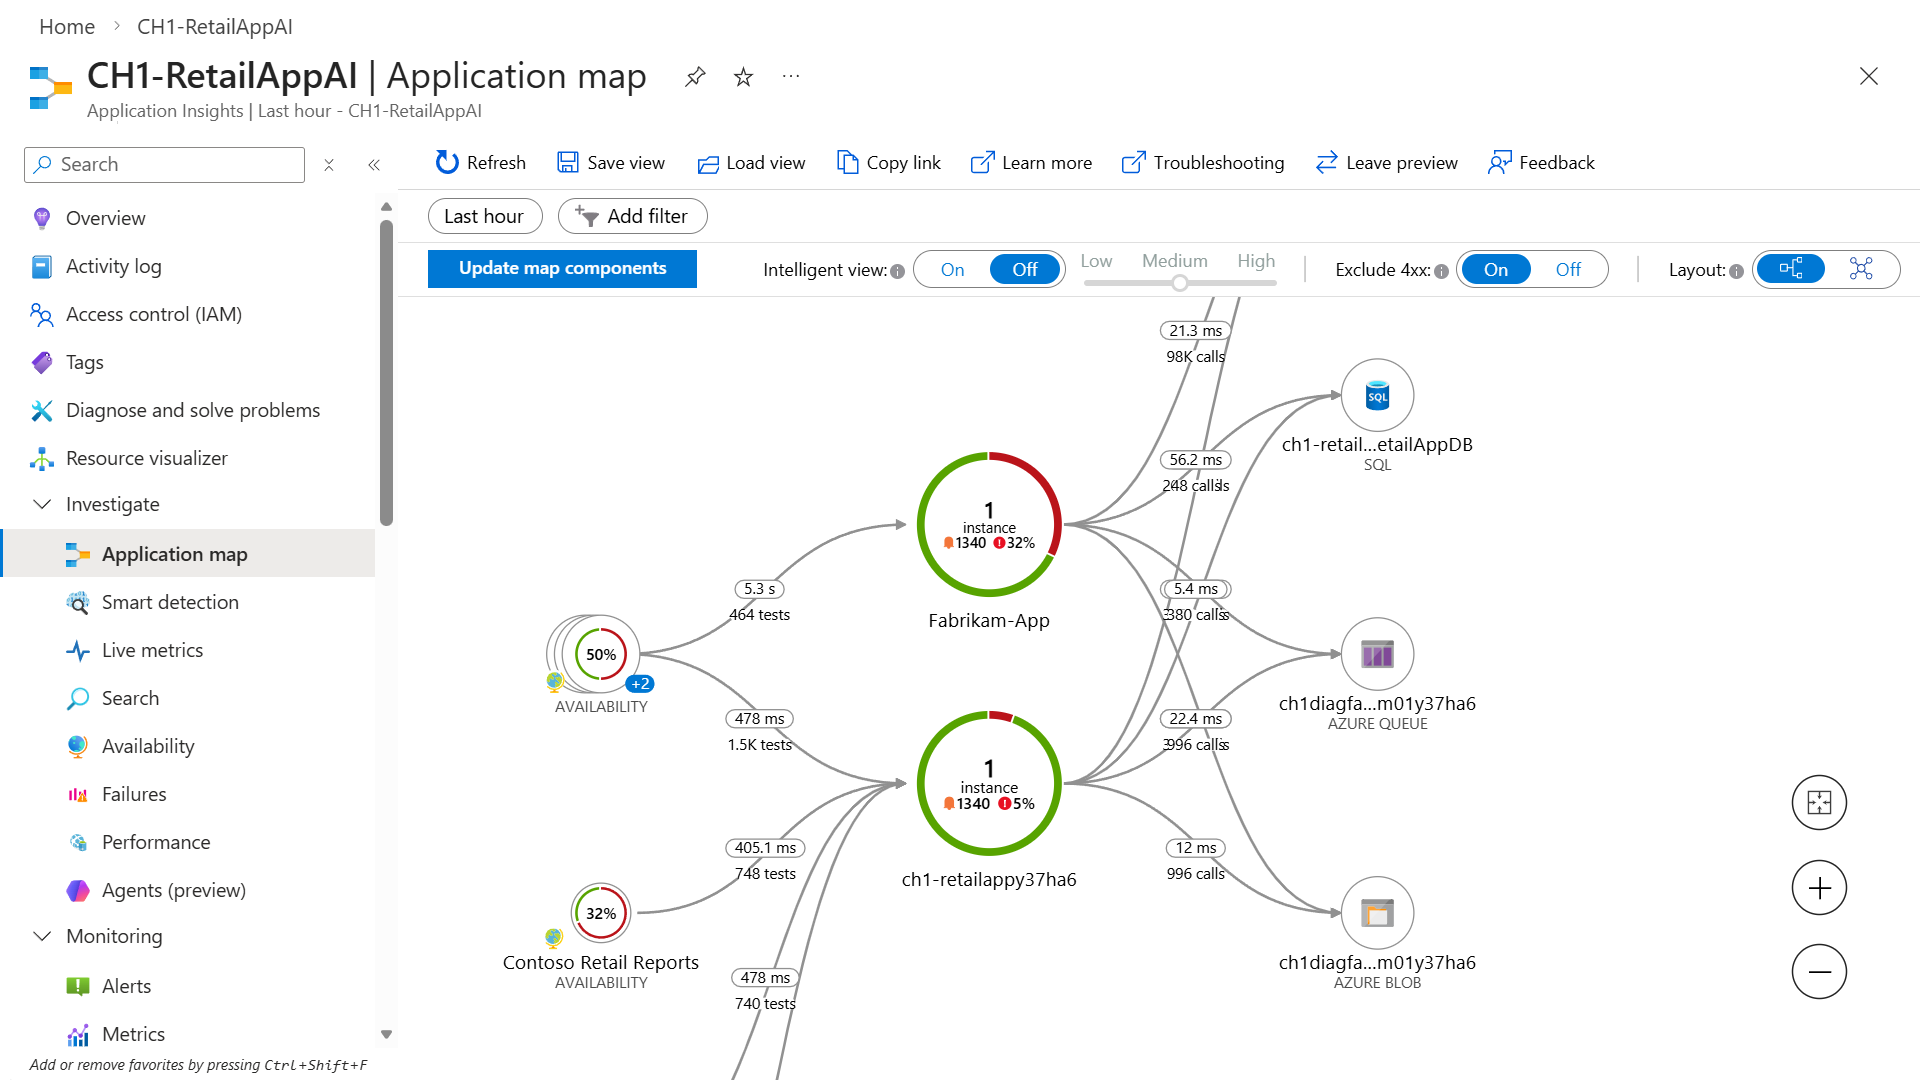
If there's one service I almost always enable, it's Application Insights.
Many people think it only tracks application errors, but it's much more than that.
It can tell you:
- Which external service is slowing down your application
A while ago, I was troubleshooting an application where users kept saying,
"The system feels slow."
Nothing looked unusual from the infrastructure side. CPU usage was normal. Memory usage was normal. The App Service Plan wasn't under pressure.
After opening Application Insights, it became obvious that almost every request was waiting on a single SQL query.
Once that query was optimized, the application's response time dropped significantly.
Without Application Insights, we probably would have spent much longer looking in the wrong place.
Live Metrics Is Great During Deployments
Whenever I deploy a new application or release a new version, I usually keep the Live Metrics blade open.
It's one of those features you don't realize you need until you're watching traffic in real time. Instead of waiting for logs to be processed, you can immediately see:
If something breaks right after deployment, you'll notice almost instantly. I've found this especially useful during after-hours deployments when everyone is watching the release closely.
Azure Monitor Helps You See the Bigger Picture
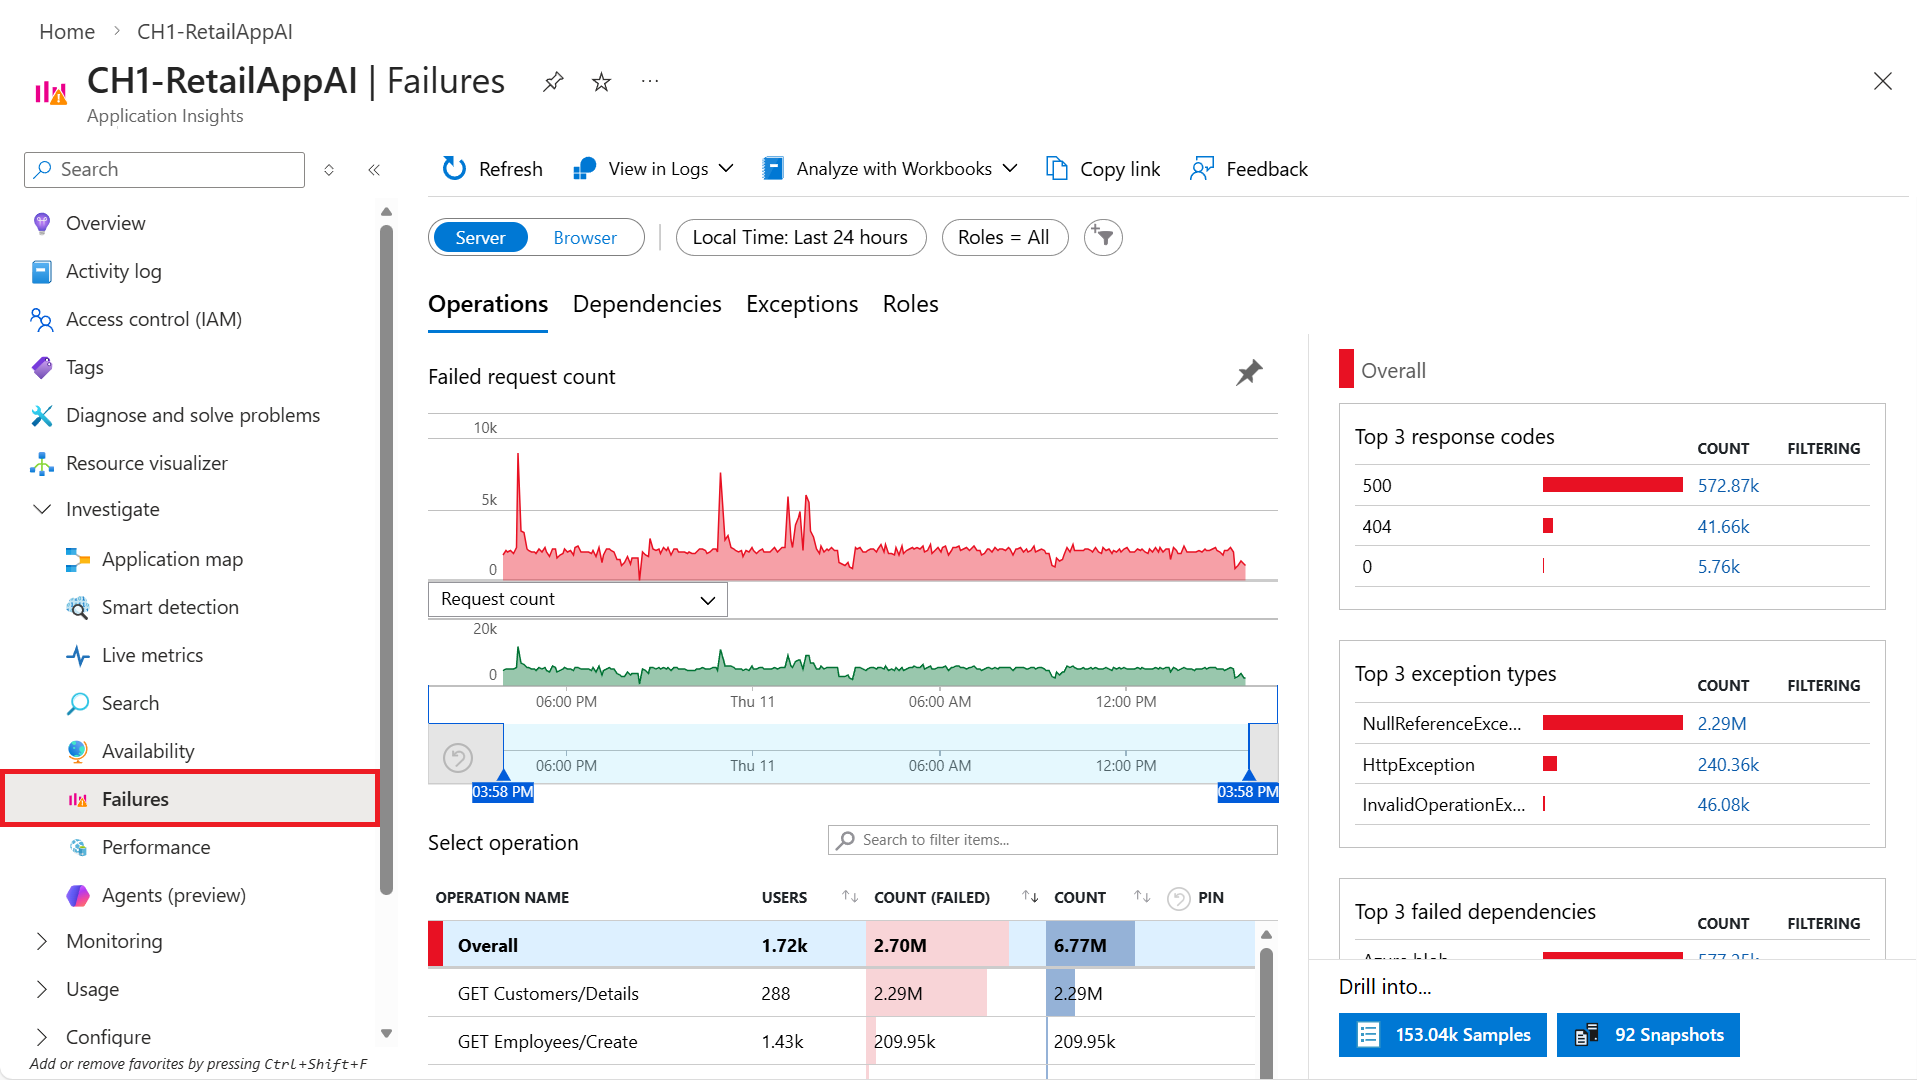
Application Insights focuses on your application. Azure Monitor gives you the bigger operational picture. I often use Azure Monitor dashboards to keep track of things like:
Over time, these metrics also help identify trends.
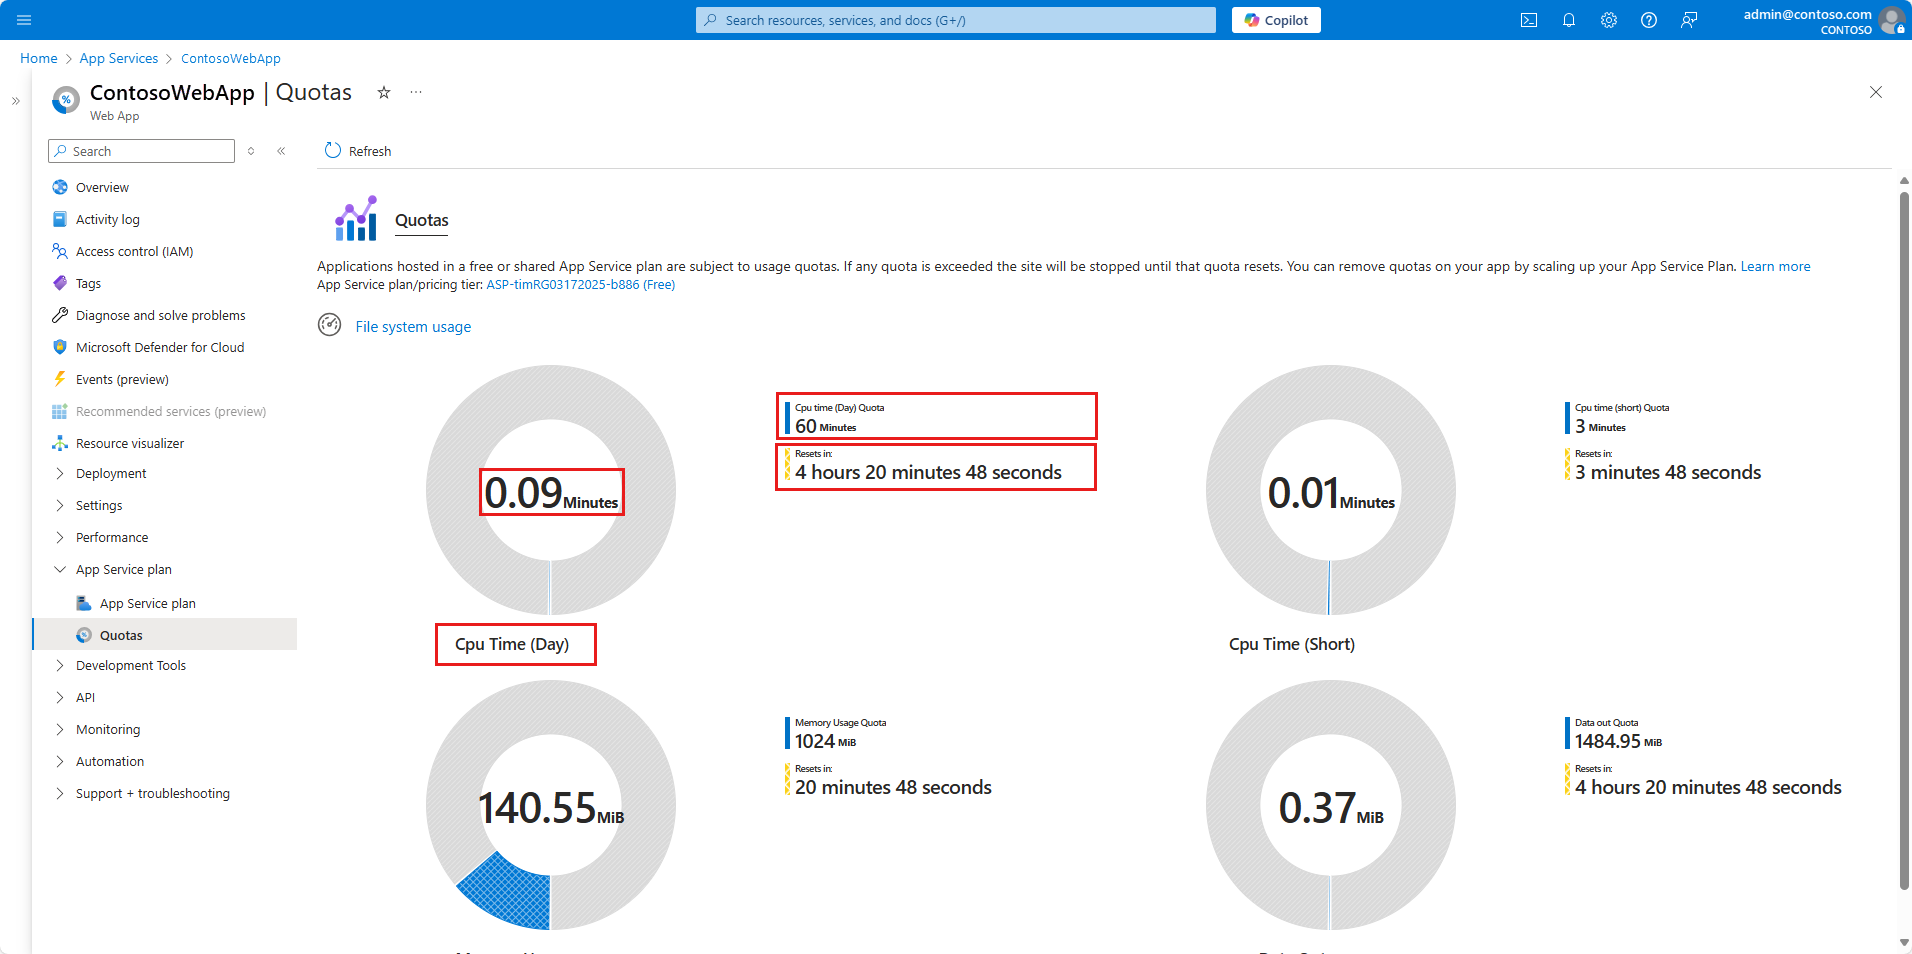
Maybe your application performs well today, but traffic has been increasing every month. Those trends can help you decide whether it's time to scale your App Service Plan before users start experiencing performance issues.
Don't Ignore Alerts
One mistake I see quite often is organizations collecting lots of monitoring data but never configuring alerts.
Monitoring without alerts is like having CCTV cameras but never looking at the footage.
For production workloads, I usually configure alerts for things such as:
- CPU staying above 80%
- High memory consumption
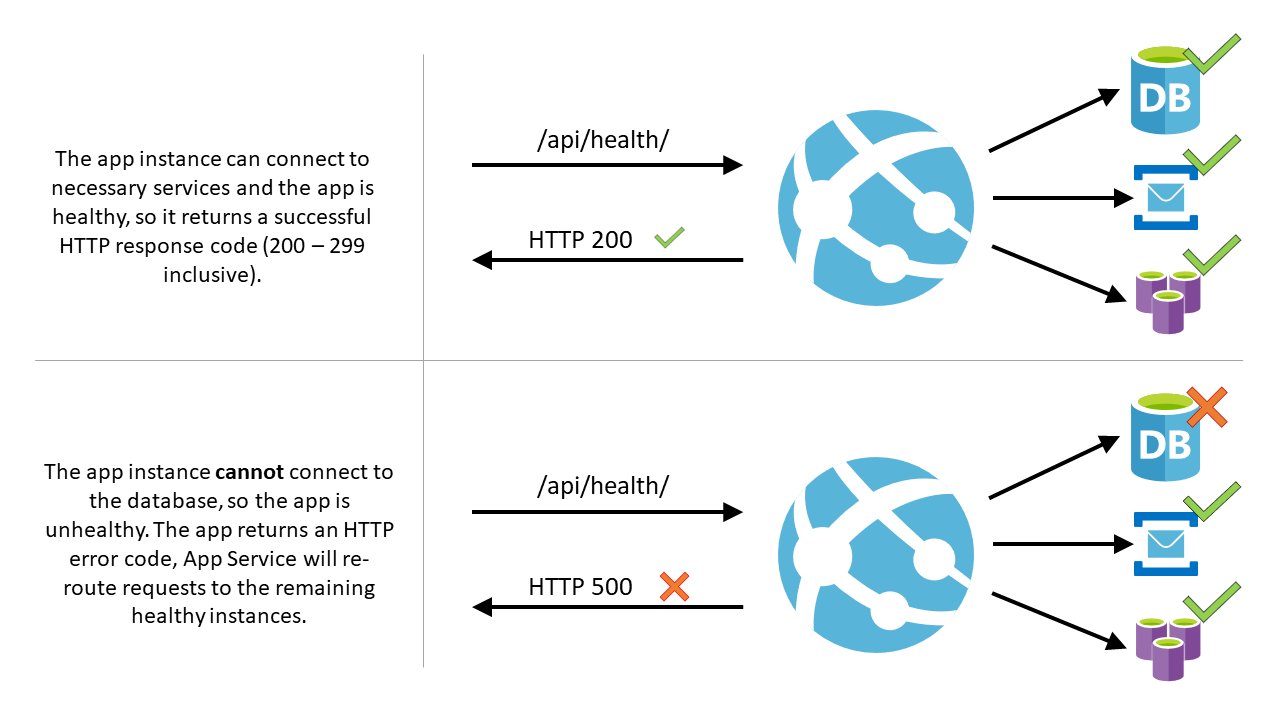
- HTTP 500 errors
- Slow response times
- Application becoming unavailable
- SSL certificates nearing expiration
The goal isn't to receive hundreds of emails every day. The goal is to receive the right notifications before your customers notice something is wrong.
Log Analytics Makes Troubleshooting Easier
When investigating production issues, Log Analytics becomes incredibly useful. Using Kusto Query Language (KQL), you can quickly answer questions like:
Instead of manually digging through log files, you can query millions of records within seconds.
If you're managing multiple Azure resources, having everything centralized in Log Analytics makes life much easier.
Performance Optimization isn't Always About Scaling
When people hear the word "performance," the first thought is often to increase the App Service Plan size. Sometimes that's the right answer.
But in many cases, it's not.
Over the years, I've seen performance improve simply by:
Throwing more CPU at a poorly optimized application only delays the real problem.
Autoscaling Is Worth Configuring
One feature I always recommend for production environments is Autoscale. Instead of running large instances all day, Azure can automatically add or remove instances based on demand.
For example:
It improves both performance and cost efficiency.
My Go-To Checklist Before Production
Whenever I'm preparing an App Service for production, I usually run through a simple checklist:
✔ Application Insights enabled
✔ Azure Monitor configured
✔ Diagnostic logs turned on
✔ Alerts configured
✔ Availability tests enabled
✔ Autoscale configured
✔ Deployment Slots ready
✔ SSL certificate monitoring enabled
✔ Backup configured
✔ Log retention reviewed
It doesn't take long to configure these, but they can save hours of troubleshooting later.
Conclusion
One thing I've learned throughout my Azure journey is that monitoring isn't just for operations teams.
Developers benefit from it.
Cloud engineers benefit from it.
Architects benefit from it.
Even business stakeholders benefit from having visibility into how their applications are performing.
Azure App Service already provides an excellent set of monitoring tools. The challenge isn't whether the tools exist, it's whether we're using them effectively.
If you're deploying applications to Azure and haven't spent much time with Application Insights or Azure Monitor yet, I'd encourage you to explore them. You'll be surprised how much they can tell you about your application, and more importantly, how many problems they can help you prevent before your users ever notice.
There are also other tools in the market for more visualisation as
- Datadog,
- Grafana + Promethesus,
- Dynatrace,
- Elastic (ELK Stack)
Based on my experience as an Azure Solutions Architect, my recommendations are:
If you're primarily on Azure: Stick with Azure Monitor + Application Insights + Log Analytics. They're deeply integrated, easy to deploy, and cost-effective.
If you're a large enterprise with multiple cloud providers: Consider Datadog or Dynatrace for unified observability across environments.
And If you're running Kubernetes or prefer open source: Grafana + Prometheus is an excellent combination. If centralized logging or security analytics is the priority: Elastic or Splunk are strong options.
In the next article, I'll be covering Deployment Slots, CI/CD pipelines, and Zero-Downtime Deployments as it is one of my favourite topics when it comes to delivering applications safely into production.
Reference
- https://learn.microsoft.com/en-us/azure/azure-monitor/fundamentals/overview
- https://learn.microsoft.com/en-us/azure/azure-monitor/app/app-insights-overview?tabs=webapps
- https://learn.microsoft.com/en-us/azure/azure-monitor/visualize/insights-overview
- https://learn.microsoft.com/en-us/azure/azure-monitor/platform/tutorial-metrics
- https://www.dynatrace.com/solutions/application-monitoring/
- https://www.datadoghq.com/
